... because the Earth's not flat
Get your Flat-Earth surveys into better shape ... with Geoida
Surveying Software for the Real World
Geoida Screenshots (v5)
Topics:
General Features
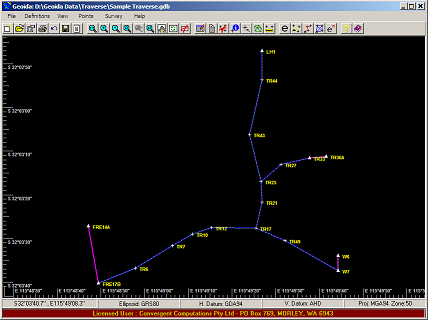
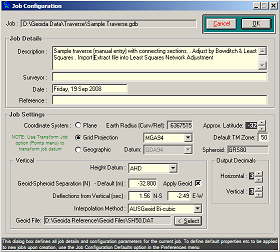
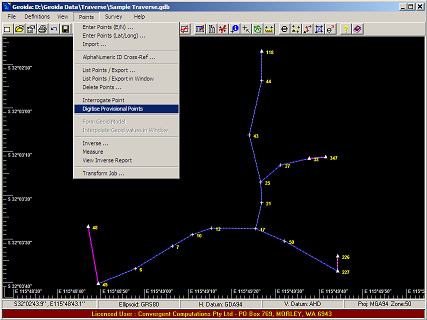
The main Geoida screen features a toolbar for quick access to commonly used options. The status bar at the foot of the screen displays details of the current job configuration for quick reference; prompts for user guidance and response may appear here also. Zoom and pan options are provided and various point details such as ID number, description, height, etc may be displayed with each point. Depending on the job properties selected, points may be displayed as either grid projection coordinates or as latitudes and longitudes.
Extensive built-in help documentation is included with Geoida and may be opened from the Help menu. For context-sensitive help relative to a particular option, press F1 on any highlighted menu option or when most dialog boxes are displayed.
The Instant Help panel is displayed (by default) at the foot of most dialog boxes or data entry windows in Geoida. When passing the mouse pointer over any active control, field or button, a context-sensitive message is displayed in this panel to explain the use of the feature. This panel may be turned off in the Help menu if not required.
Extensive built-in help documentation is included with Geoida and may be opened from the Help menu. For context-sensitive help relative to a particular option, press on any highlighted menu option or when most dialog boxes are displayed.
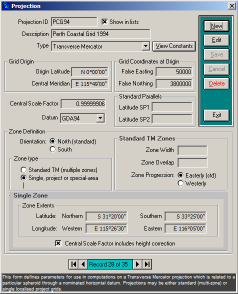
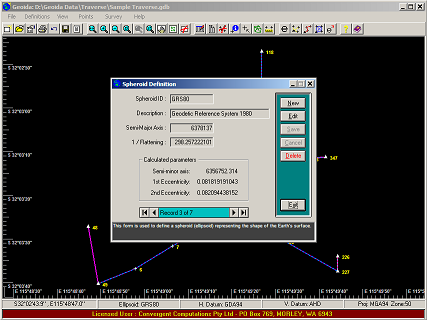
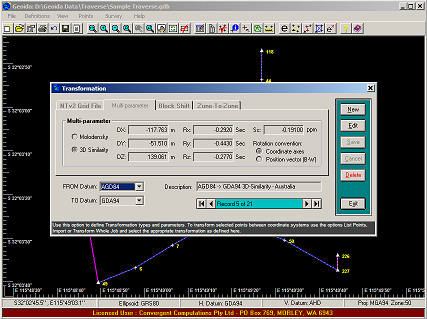
Geoida's Definitions library contains details of user-definable spheroids, datums, projections and transformations. The library is already pre-loaded with numerous definitions relating mainly to the Australian continent, but new entries can be added as required for any global location.
A number of different coordinate transformation methods are available in Geoida and are defined in the Definition library for later application to the Import, List Points and Transform Job options.
Points Management
Use the Enter Points (E/N) or Enter Points (Lat/Long) options to enter details of control points into the database. Control points will normally be set 'Fixed' so that they are not modified during processing; if points are already defined elsewhere (eg in a digital data file to be processed), all that is required is for the point number to be entered and 'Fixed' crossed while the actual coordinate values and other details may be omitted..
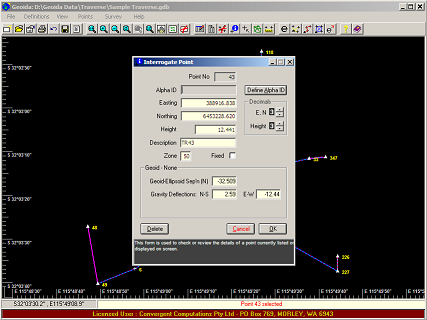
Individual points may be enquired or modified using the Interrogate Points option. To create provisional points for a least squares network adjustment, the Digitise Point option may be used to click a new point's approximate position on the screen after which this same window will be displayed to finalise the point number and other values.
The List Points option is used to list existing point details in a variety of formats for quickly viewing point details, to create files for transfering data internally (between jobs) or for export, or for reporting purposes. Additionally, points may also be transformed to another coordinate type or datum, GPS-derived spheroidal heights can be combined with interpolated geoid-spheroid separation to report orthometric heights, and points may be individually modified.
Survey Processing
Geoida can process manually-entered survey observations or various forms of digital data. This may be in the form of detail pick-up, traverse or network survey data entered manually as radiations or traverse observations, or can be extracted from Sokkia SDR, TDS or SurvCE RW5 data files, Civilcad Neutral or CDS Stadia files.
In a single processing run, Geoida can handle multiple traverses in many complex arrangements where traverses may be adjusted by the traditional Bowditch method or by least-squares.
Every option that processes traverse or network observations (but not the Radiations or Least Squares Network Adjustment options) also writes all of these observations to a Geoida Extract file. This is a text file that may be edited to insert, rearrange or remove observations or to combine with other extract files into a single collection of traverse or network observations. An extract file can then be loaded for final processing using either of the Process Extracted Observations or Least Squares Network Adjustment options in the Advanced Processing menu.
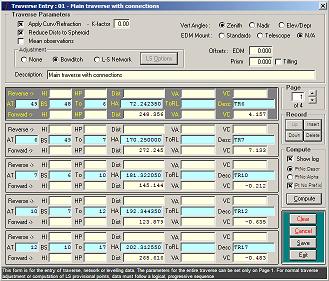
A traverse or network to be adjusted by least squares in the Traverse option may consist of angle, direction, azimuth, distance and height-difference observations and may be processed as 1D vertical or 2D horizontal networks. Additional spatial observations including GPS can be processed by the Lease Squares Network Adjustment option - see Least-Squares Adjustment below.
Traverse, network or levelling observations may be entered manually and adjusted using Geoida's comprehensive Traverse option.
Least-Squares Adjustment
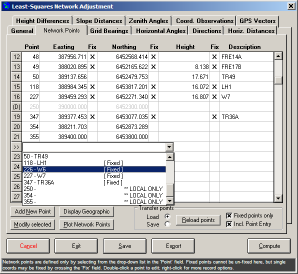
This is Geoida's Least Squares Network Adjustment option and provides a means of importing observation data from other sources, editing of observation data, setting adjustment parameters, etc prior to computing the adjustment. Individual sets of data may be created.
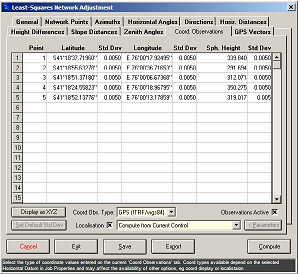
A network for least squares adjustment may consist of horizontal angles and directions, azimuth, horizontal and slope distances, height-difference or level observations, vertical (zenith) angles, coordinate observations and GPS baseline vectors. These may be processed as 1D vertical, 2D horizontal, or 3D spatial networks, depending on the observation types, and for a 3D spatial adjustment, GPS observations can be combined with any appropriate terrestrial observations. A wide range of data formats may be imported.
Settings for least squares adjustment.
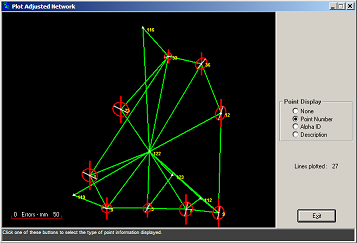
At the conclusion of an adjustment, a plot of the network is displayed showing the relationships of the different observation types by colour and line style , and depending on the adjusted dimensions, showing horizontal error ellipses with orientation and/or vertical error bars. Full details of the adjusted observations, point locations, confidence regions and other statistical information are included in the least-squares adjustment summary.
A summary report is produced during survey data processing to show full details of a Bowditch traverse adjustment or a least squares adjustment. The least squares summary reports individual observation analysis (eg standard deviation, outlier flagging, redundancy number), statistical analysis of the adjustment (eg residuals test, estimated variance factor, chi-squared test) and lists standard and relative error ellipses according to the selected confidence region.
.png)
.png)
Also included in a 3D least-squares adjustment summary report will be details of any localisation performed on control points and GPS observations prior to adjustment.
.png)
